

![]()
Description
H13 is a report that uses various health indicators to measure the performance and operational efficiency of the revenue cycle management and to help identify areas of improvement for the Practice’s revenue cycle operations. In the report, users will have access to key billing metrics such as the First Pass Resolution Rate, A/R days, Gross and Net Collections rate, Charge and Payment lags, and other metrics to see where they stand in comparison with the 6-month average.
Significance
- This report presents a trend analysis based on historical data from the past six months.
- Tooltips for all parameters in KPI Report display the formulae used for calculation. Users can click on the question mark symbol to view the formula.
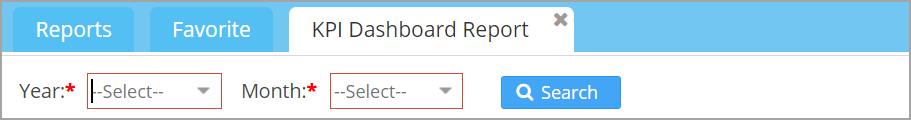
Search Filters of H13 Report
| Field | Description |
| Year | Select a year from the drop-down note: The most recent year displayed in the drop-down will be the calendar year of the last closed month. |
| Month | Select a month from the drop-down The most recent month in the drop-down will be the last closed month. |
Search Screen of H13 Report
Sample H13 Report
 Image 1
Table 1 explains each row in detail. Assumes search criteria as Sept 2019 for reviewing the table.
| Column Name | Date Reported | Month Wise | 6 Month Average | Year To Date | Variance |
|---|---|---|---|---|---|
| Practice Operations | |||||
| Appointment Count | Appt. Date | Count of appointments for all schedule status except “Void” and “Missed” for the month. | 6-month average excluding “Void” and “Missed”. | YTD appointment count excluding “Void” and “Missed”. | ((6 month average − month wise) / 6 month average) × 100 |
| Appointment Cancellation Rate | Appt. Date | (Cancelled appointments / total appointments) × 100 for the month. | (Cancelled appointments / total appointments) × 100 for previous 6 months. | (Cancelled appointments / total appointments) × 100 YTD. | |
| Appointment No Show Rate | Appt. Date | (No-show appointments / total appointments) × 100 for the month. | (No-show appointments / total appointments) × 100 for previous 6 months. | (No-show appointments / total appointments) × 100 YTD. | |
| Eligibility Verification Rate | Appt. Date | (Appointments verified / total valid appointments) × 100 for the month. | (Appointments verified / total valid appointments) × 100 for previous 6 months. | (Appointments verified / total valid appointments) × 100 YTD. | |
| Unbilled Insurance Charges | Accounting Date | Total charges with status “New” for the month. | Average unbilled charges for previous 6 months. | Total unbilled charges YTD. | |
| Charge Entry Lag | Date of Service | Average days between DOS and charge entry for the month. | Average days between DOS and charge entry for previous 6 months. | Average days between DOS and charge entry YTD. | |
| Charge Submission Lag | Date of Service | Average days between DOS and first claim submission for the month. | Average days between DOS and first claim submission for previous 6 months. | Average days between DOS and first claim submission YTD. | |
| Payment Lag | Date of Service | Average days between DOS and first payment for the month. | Average days between DOS and first payment for previous 6 months. | Average days between DOS and first payment YTD. | |
| Patient Visits | Acct. Date | Distinct patient encounters for the month. | Average patient encounters for previous 6 months. | Distinct patient encounters YTD. | |
| Unbilled Visits Without Charges | Acct. Date | Unbilled encounters for the month. | Average unbilled encounters for previous 6 months. | — | |
| RCM Key Performance Indicators | |||||
| First Pass Resolution Rate | Claim Date | (Resolved on first submission / total resolved) × 100. | 6-month average. | YTD resolution rate. | ((6 month average − month wise) / 6 month average) × 100 |
| First Pass Denial Rate | Claim Date | (Denied lines / submitted lines) × 100. | 6-month average. | YTD denial rate. | |
| First Pass No-Response Rate | Claim Date | (No-response lines / submitted lines) × 100. | 6-month average. | YTD no-response rate. | |
| Gross Collection Rate | Acct. Date | (Total payments / total charges) × 100. | 6-month average. | YTD gross collection rate. | |
| Net Collection Rate | Acct. Date | (Payments / (charges − adjustments)) × 100. | 6-month average. | YTD net collection rate. | |
| Revenue Cycle | |||||
| Total Charges | Acct. Date | Total charges for the month. | Average charges for previous 6 months. | Total charges YTD. | ((6 month average − month wise) / 6 month average) × 100 |
Was this helpful?
Thanks for your feedback!