

Version 3 Charting
The Version 3 EHR charting tool has a WYSIWYG (What You See is What You Get) typestyle interface. The upgraded inline editor gives users instant visibility to all Level-1 and Level-2s without any additional clicks. For users either reviewing a chart or modifying it, the entries under the header are always visible; hence, referencing them becomes easier, enhancing the charting experience and making charting quicker and effortless. Additionally, a “Hide/Show All” option is available on the screen that can be used to condense the chart to merely display those headers that have info saved under them or the expanded view with all the elements displayed. The major highlights of the upgrade are given below:
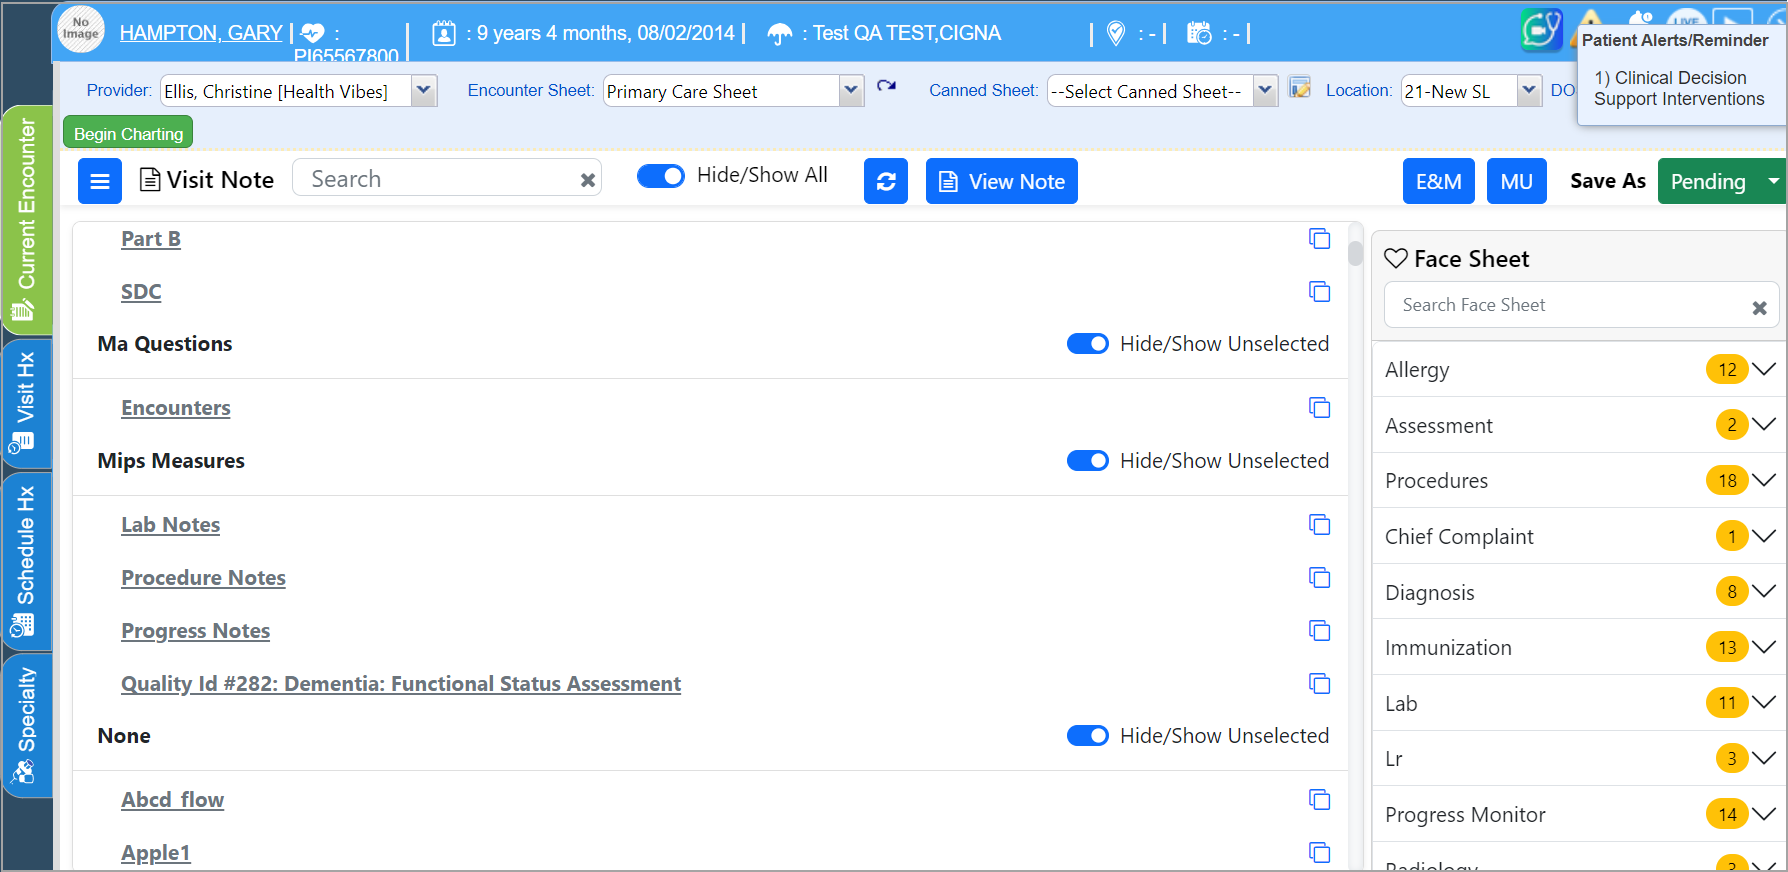
1. Users can now view the data entered in Level 2 under the respective headers by simply scrolling up or down in the charting area. Headers with data will be displayed in green text with a green tick beside them. See Image 1.1.
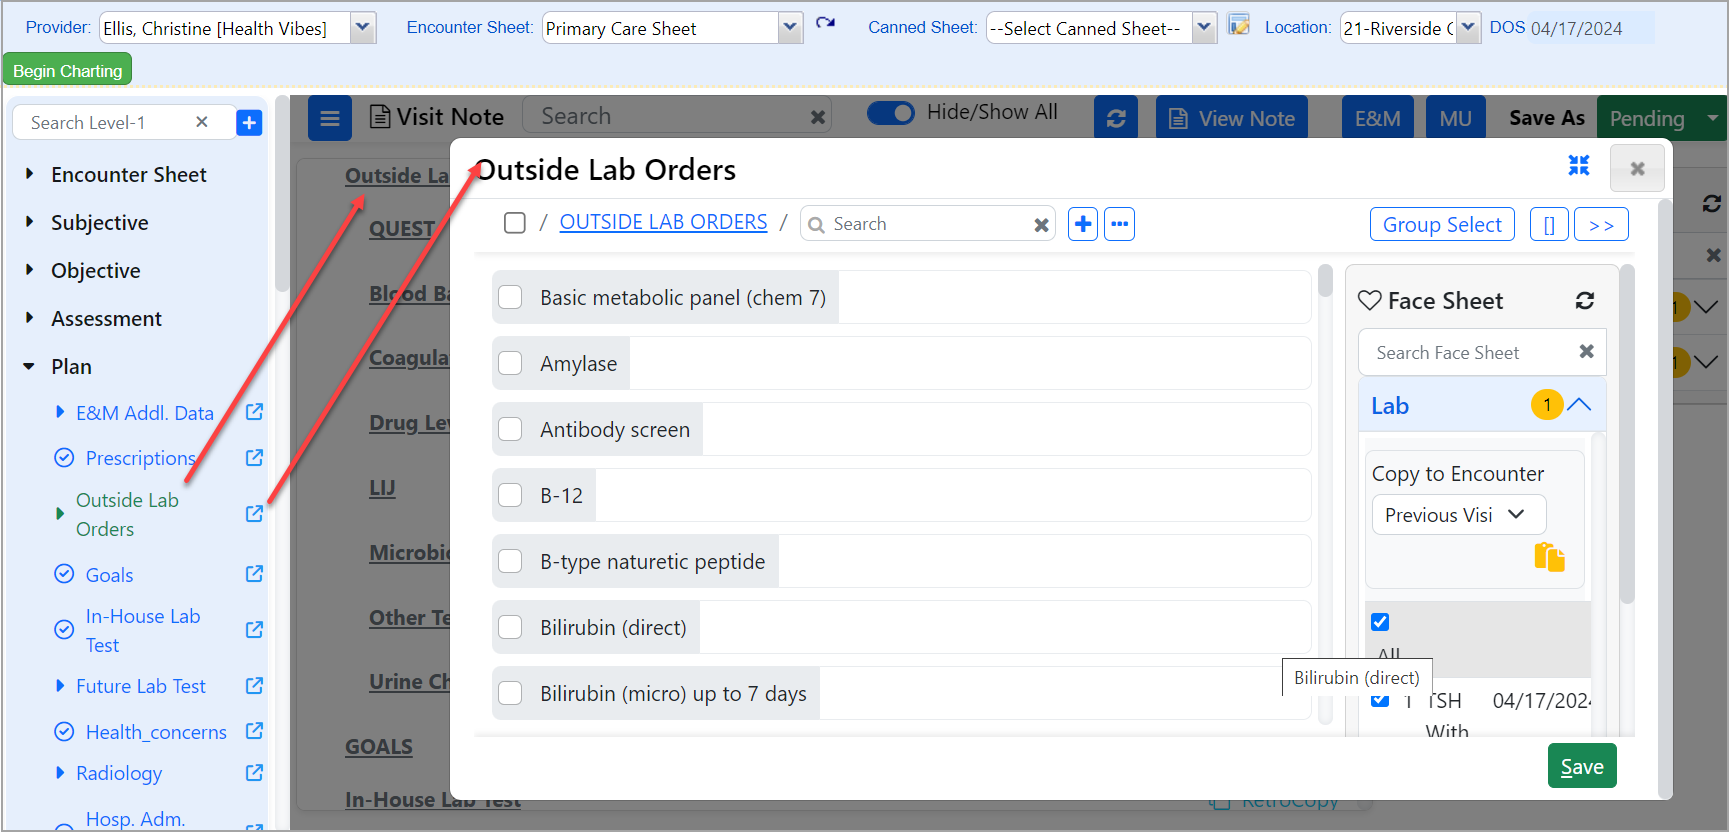
2. To insert into an L2, click on the header, and that opens a pop-up with the level-2s. Enter info into the required level-2 and save to return to the main screen displaying the entered information under the selected header; see GIF 1
3. To modify the information that is entered, the user can click on the L2 to make the area editable and then type to edit. Clicking on the “X” next to the entry removes the saved information. Please see GIF 1.
GIF 1
4. Extended the copy feature to the component level. A new copy option is made available beside the L1 header to copy elements from an existing canned sheet into L1.
5. All Facesheet items are grouped by date. Additionally, the pop-up window will have the option to copy the Facesheet.
6. The “Hide/Show All” option is made available at both the top level (for the entire note) and within each SOAP item. Clicking on “Hide” displays only the headers that have data, hiding the others.
7. The ![]() button at the top of the editor displays the clinical note as a popup. Users, without having to leave edit mode, can now access the visit note.
button at the top of the editor displays the clinical note as a popup. Users, without having to leave edit mode, can now access the visit note.
8. The upgraded charting screen is mobile-friendly and has improved navigation, significantly reducing side-scrolling.
9. A new autosave feature is added to the narration editor.
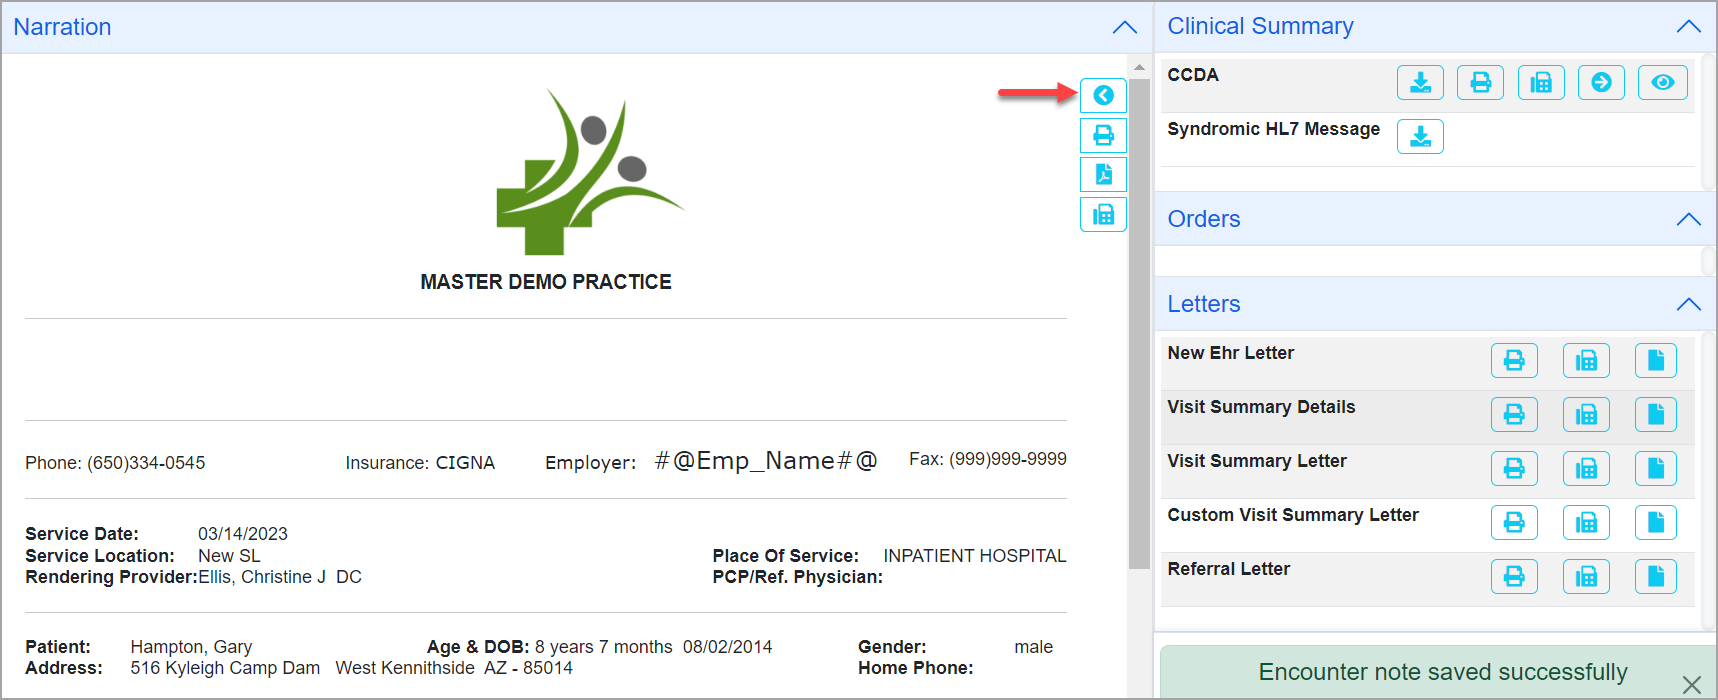
10. The option to open a visit note in editor mode is available on the chart narration screen.
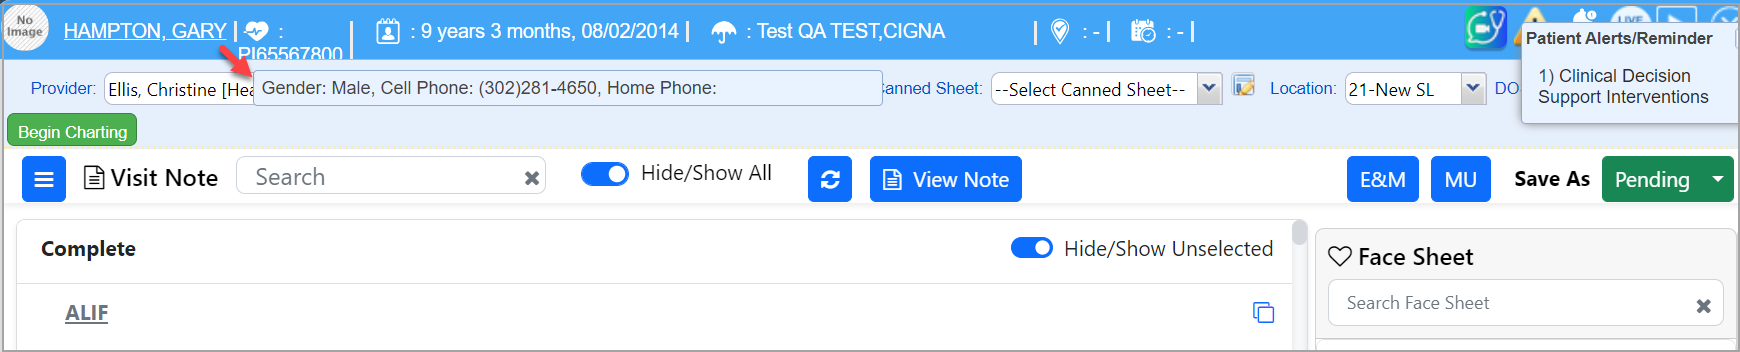
11. The patient name on the top left-hand corner of the charting screen is a hyperlink, and clicking on the link opens the patient’s demographic screen. To continue charting, the user will need to first exit the demographics screen. Also, mouse over the patient’s name to view the cell phone number, gender, and home phone number. Previously, only the gender and home phone numbers appeared in the tooltip. (This feature is available in the classic version as well.)
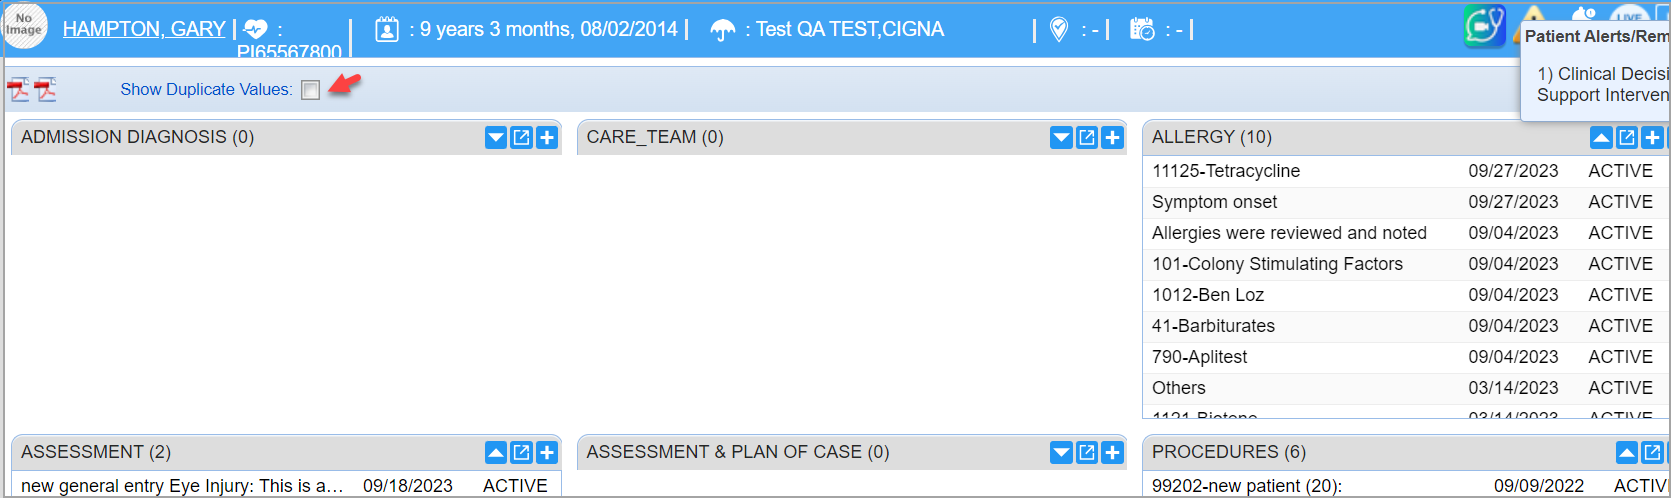
12. Duplicate entries in the Facesheet tab will be hidden by default (this is applicable for the classic version as well). Users can check the box “Show Duplicate Values” present on the top left-hand side corner to view any duplicates.
13. The left-hand side navigation tree of level 1 components on the charting screen will remain open by default. Users can utilize this feature to navigate easily from one component to another by clicking on the component rather than scrolling through the entire narration editor. Click on Level 1 to access it, and clicking the ![]() beside Level 1 opens the Level 2 popup screen directly.
beside Level 1 opens the Level 2 popup screen directly.
14. Entries are case-sensitive; the typed-in case will be reflected in the narration as well.
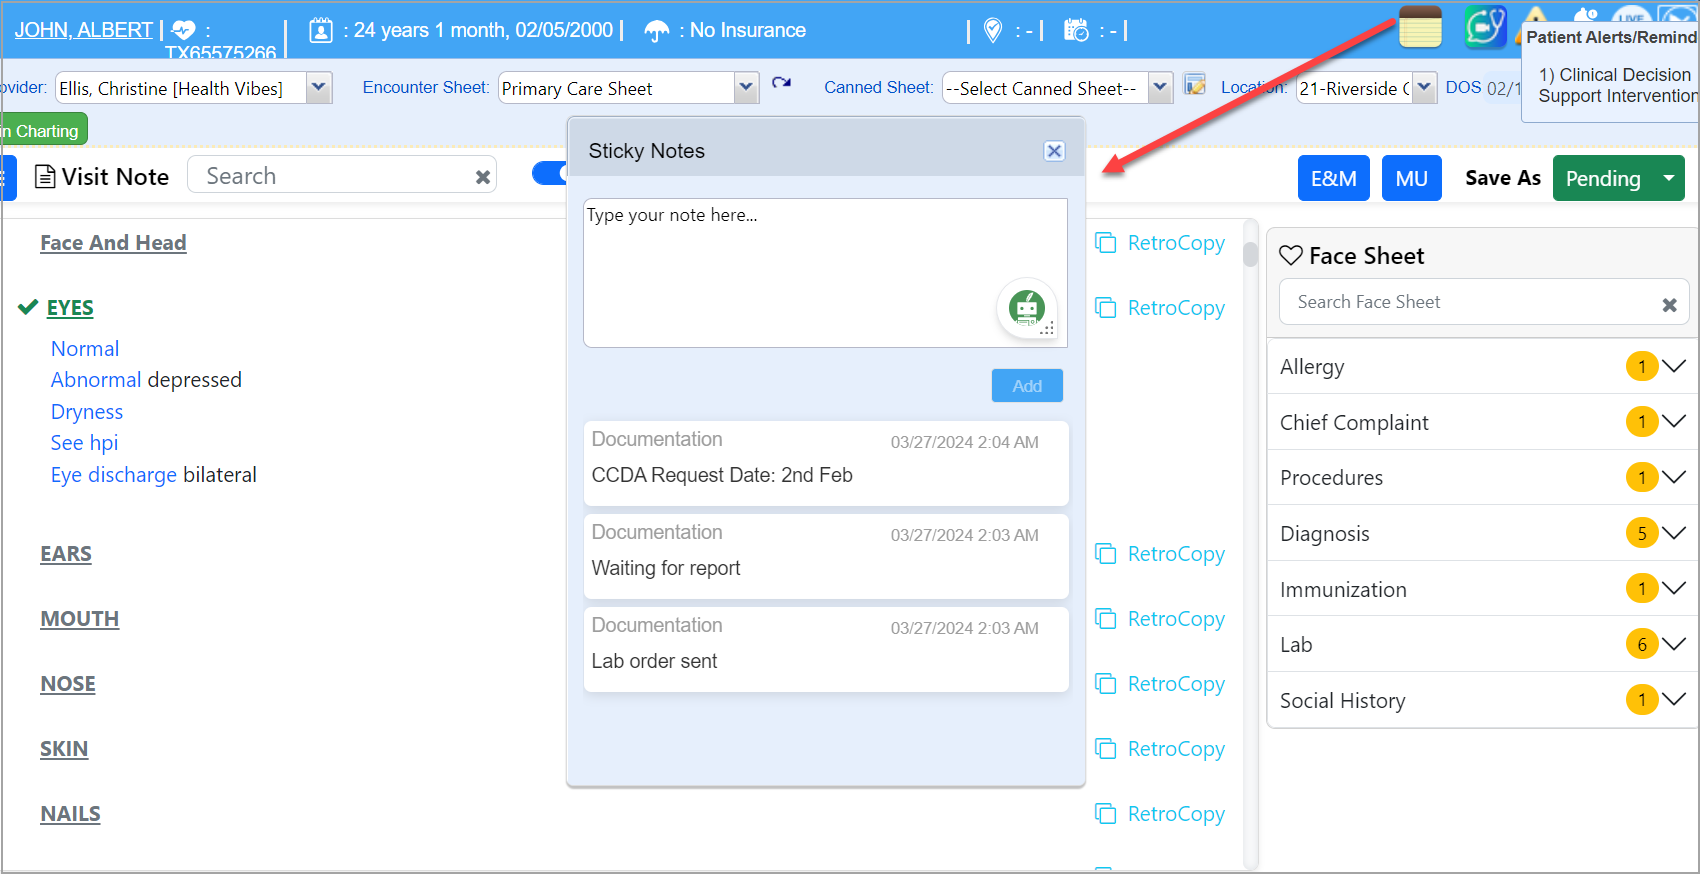
Sticky Notes
A new sticky notes feature has been introduced on the charting screen and it can be accessed from both the charting area and the patient demographics screen. Users can click on the notes icon at the top right-hand corner of the screen to add a new note or to view existing notes. A sticky note can only be voided or deleted from the patient demographics screen. This feature is available in the classic version as well.
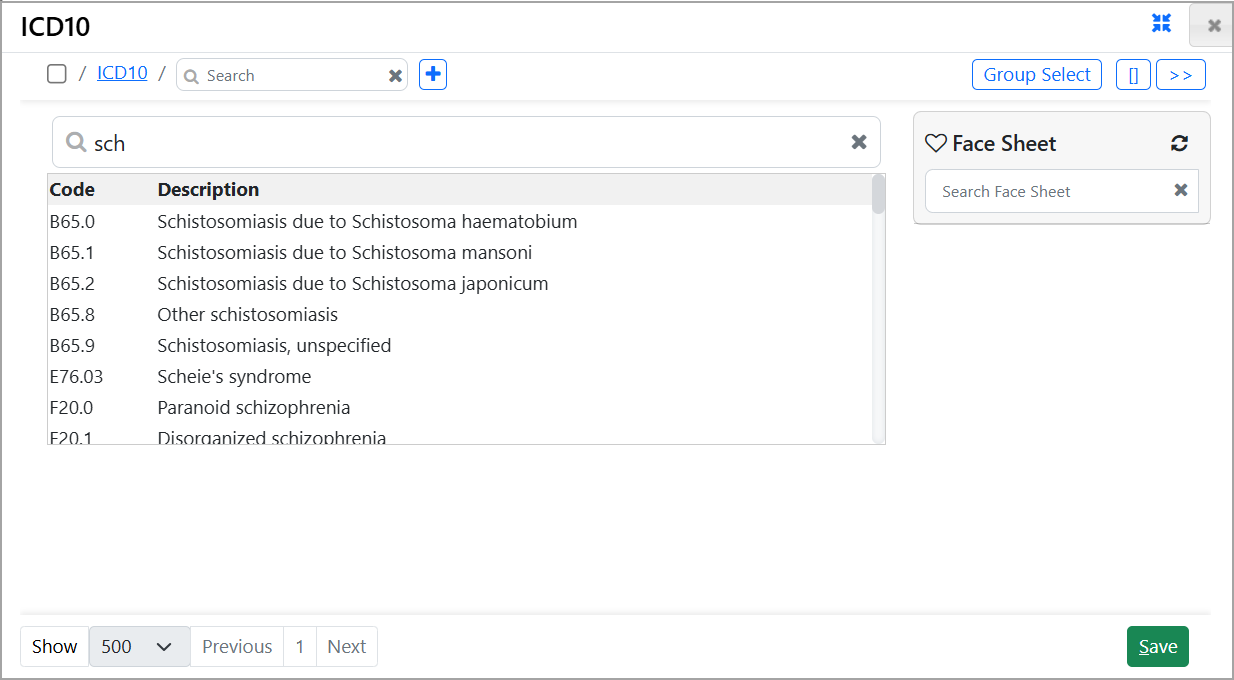
Enhanced ICD Search
Level-2 ICD-10 has been updated to improve user experience and speed. The new instant search replaces the prior repository-based search. The following changes are available with this update:
1. Instant Search: Users can instantly search and select diagnosis code(s) from the new pop-up screen (please refer to the image below) All the diagnosis codes selected are added to Level-2.
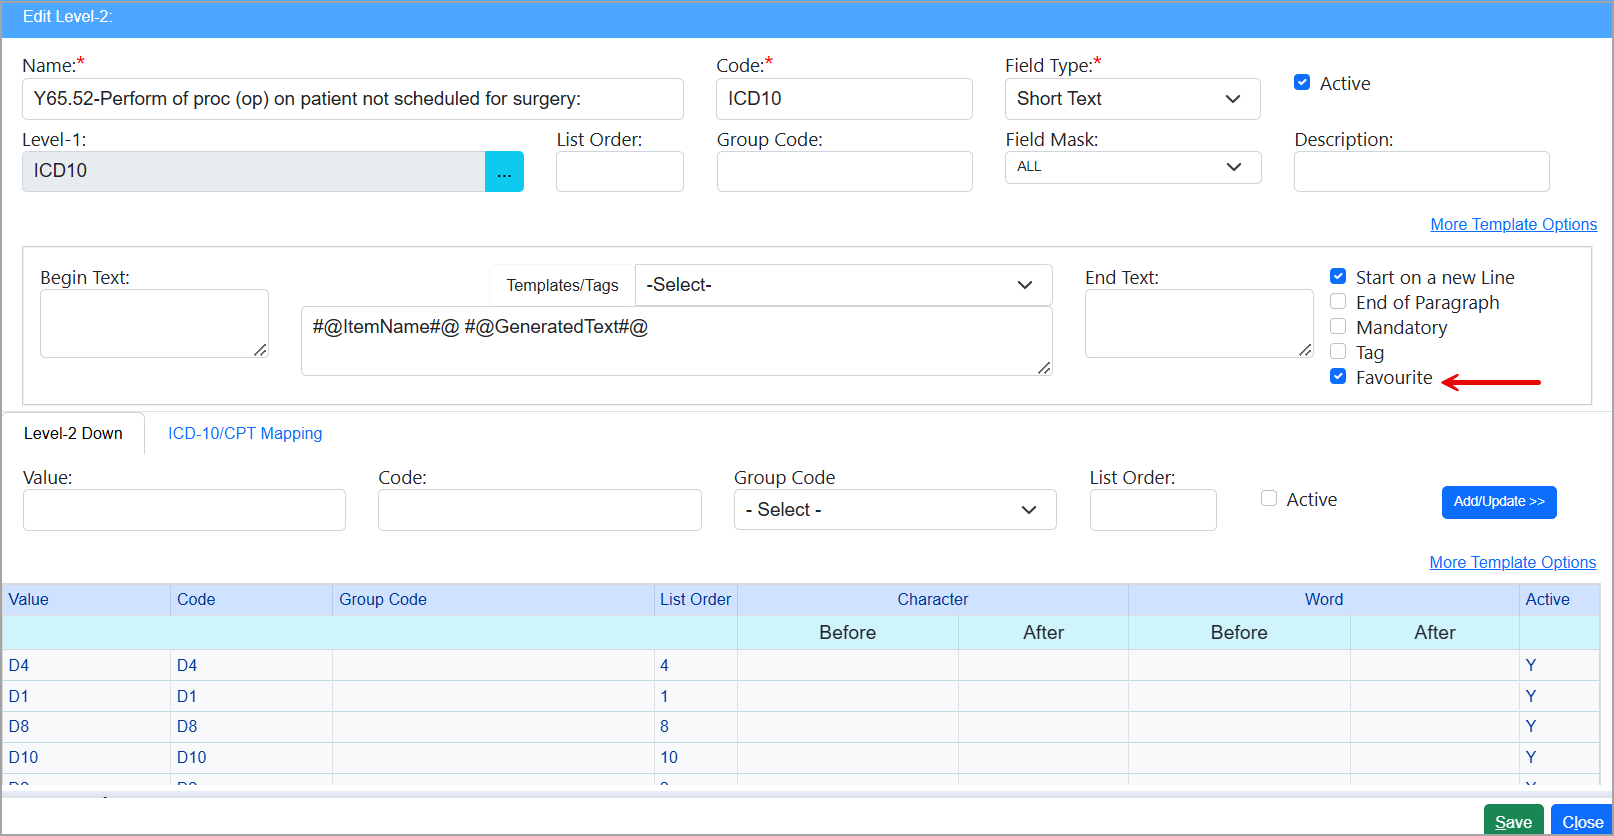
2. Favorites: Any level-2 ICD code can be marked as a favorite to have it appear for every patient where the same encounter sheet is used. Clicking the “+” adds the code to the favorites list, as shown in the image below.
3. New Patients: The Level-2 ICD will not contain any info for the new patients.
4. The diagnosis code listed in the facesheet can be copied to the clinical note even if it is not marked as a favorite.