

Description
Aimed at improving laboratory data comprehension, graphical displays of laboratory test results of patients have been made available in the EHR (see Image 1).
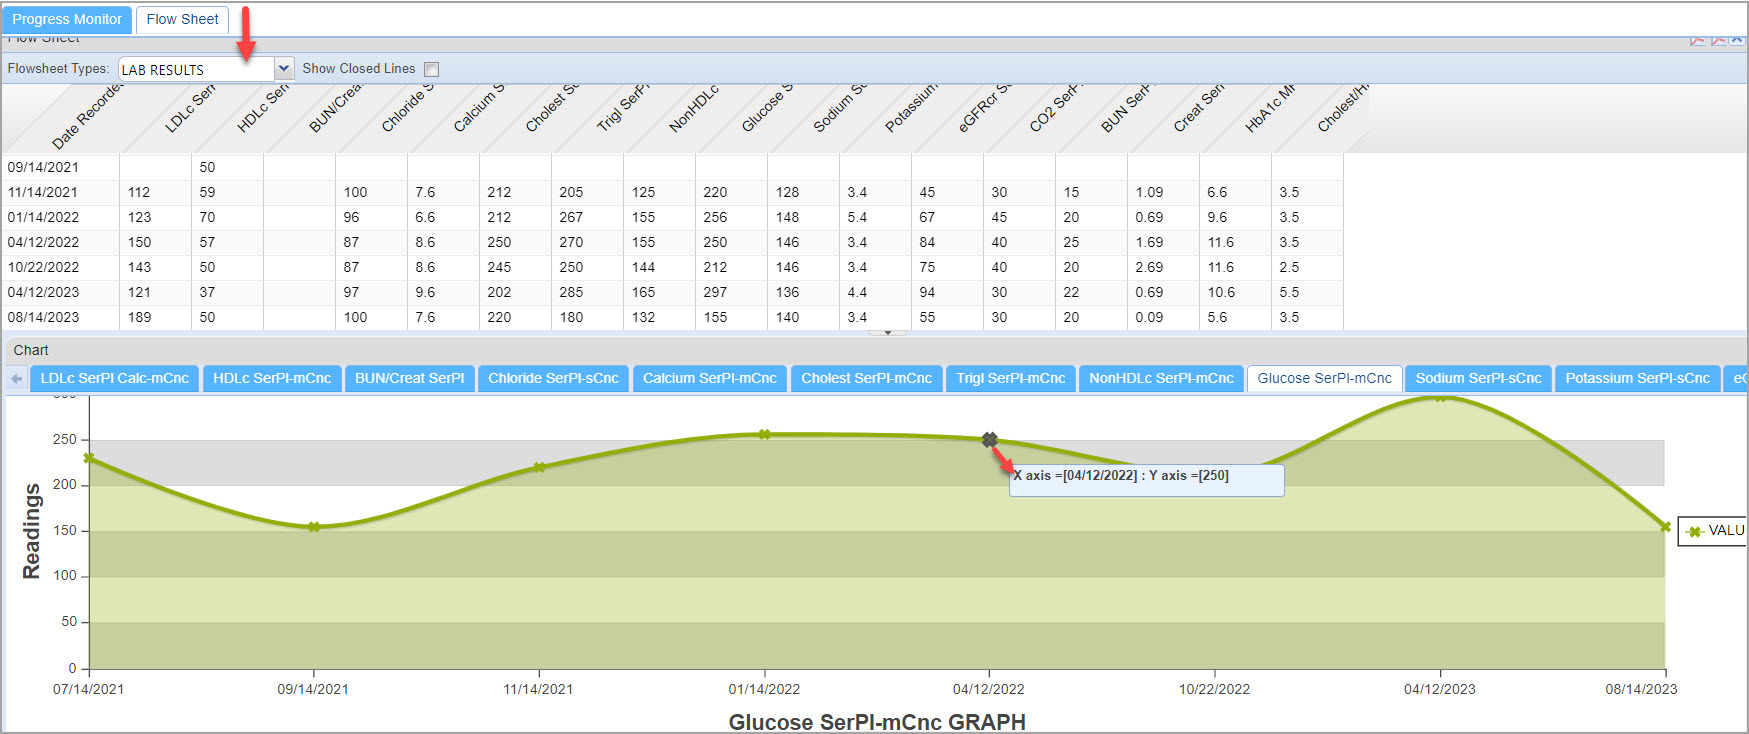
Numerical data will be represented in tabular form in the upper section. Positive and negative values in the result can be plotted in the lab trending graph in the lower section.
Non-numerical values will be shown in tabular form in the upper section.
How to Access EHR Graphs
The graphs are available under the Flowsheet tab on the charting screen. Select LAB RESULTS from the ‘Flowsheet Types’ dropdown. The numerical values of the lab results are provided in the upper pane. Click on any result in the upper pane to display the related graph in the lower pane.
Sample Graph
Was this helpful?
Thanks for your feedback!